Sunday, July 31, 2005

Will Hunter's Injury Spell Disaster?


The loss of Torii Hunter appears devastating to a team already in offensive dire straits. If nothing else, making the front page of espn.com means that Hunter's loss must be big news, possibly spelling the end of 2005 for the Twins and an October at home for the first time since 2001. After losing their first three games without Hunter to the Red Sox (counting the game in which he was injured in the first inning), the team now stands at 54-50, 14 games behind the White Sox and 4 games behind the A's in the Wild Card chase. I can't help but thinking Terry Ryan chose not to mortgage the future on Youkilis/Cruz or Soriano at least partially because he saw the rest of the season as a lost cause.

Will Carroll knows more about baseball injuries than almost anyone, so I'll default to his pessimistic reaction to Hunter's injury. Torii doesn't have a terribly long injury history, so we don't know all that much about his typical recovery time, but we can safely say that slow-healing ankle ligament injury is going to pretty damaging for a player who gets much of his value from speed. The front office is obviously aware of all of these factors, so Hunter probably won't be rushed back into a losing situation if it means any additional risk of coming back at less than full strength in the future. What I'm getting at here is that I don't expect to see him patrolling CF at all the rest of the season.

But the real question is whether Torii's injury will have much of an impact on the offense, as Lew Ford should be a decent offensive replacement, at least in theory, and Matt Lecroy should get most of the rest of the ABs. The team is already in a free fall, and the offense was looking pretty hopeless even with Torii's solid contributions, so the importance of the injury may be little more than the icing on the cake, or the bow on the journalists' neatly packaged "Twins' 05, Year in Review" story due in newspapers in mid-October. I've chosen to use the same Marginal Lineup Value Rate tool that I used to measure the impact of different versions of Bret Boone to the lineup. As a quick review, MLVr measures the contribution one player can make to a league average offense. Since the Twins are below league average, negative contributions will be overstated and positive ones understated. In other words, a good offensive player is particularly valuable to a bad lineup, which was the case with Torii's productive 2005. Here's a more complete picture of what we stand to lose, assuming Ford takes over in CF and Lecroy gets most of the extra PAs by taking Ford's DH spot (I used Lecroy's career stats because he only has 151 ABs on the season, which may present too optimistic of a forecast):

League Average Lineup: .269/.330/.426, 794.44 Runs
Hunter: .269/.337/.452, 803.53 Runs, 9.09 Runs added/162, MLVr = .056
Lecroy: .265/.325/.450, 796.59 Runs, 2.15 Runs added/162, MLVr = .013

Over a full season, Hunter's 2005 has been about 7 runs better than Lecroy's career line. Maybe Lecroy's outlier short season actually demonstrates real improvement, but the greater likelihood is that he just hasn't played enough games for his stats to average out yet, and he has been the beneficiary of careful use: good platoon advantages and lots of rest. Seven runs is enough to pay attention to, but isn't the huge offensive loss that we would assume from losing our perceived best player. With only 58 games to play, the difference is even less.

Hunter: +3.25 runs
Lecroy: +.75 runs

Offensively, Hunter's injury should only cost the Twins about 2.5 runs if Lecroy regresses to his career stats. But Hunter's perceived value has long been in his glove. His fielding, however, has slowly declined since he passed his physical peak and accumulated minor nagging injuries by playing his all-out, Superman style. He has still put up a Rate2 of 104 in CF this year, making him good for 4 runs over average every 100 games. By comparison, Ford has a career Rate2 of 96 in CF, a more meaningful number than the single-season datum since he's only seen action in 14 games there this year. With only 58 games remaining, the defensive switch will cost somewhere around 4.5 runs, for a total loss of about 7 runs due to losing Hunter.

It's not surprising that Hunter's offensive is more easily replaced than his defense, but it is surprising how little the Twins stand to lose from his injury. Seven runs probably won't even make one full win of difference for the rest of the season, so anyone pinning the Twins' demise on Hunter's injury would be badly mistaken.

Friday, July 29, 2005

The Crain Drain
More on the diminishing K/9 and what it means

Aaron Gleeman wrote an article for The Hardball Times today on a subject I’ve commented on a couple of times: Jesse Crain’s vanishing strikeout rate. While I agree with his main premise, I think he undervalues the importance of Crain’s lost strikeouts.

Crain is a unique case in that he’s near the top of almost every leaderboard for relief pitchers, sometimes for the best and sometimes not. For one, he has a narrow lead over Joe Nathan for 12th in the majors in Relieve Expected Wins Added at 2.397, also good for 7th in the AL. He has actually been even better than that, but many of those in front of him face higher-leverage situations as closers, or even primary set-up men, and WXRL takes into account the importance of the situation based on game state data. On top of that, his first order pitching stats look shiny, too. For instance, he’s sporting a 2.49 ERA and a 9-1 record, enough to make Dick and Bert salivate over his new two-seamer.

But here’s what I wrote about him in my first half review column, explaining why he wasn’t a choice for one of the “Happiest Surprises:”
Jesse Crain: The wins and the “vulture” tag are fun, but don’t be duped into thinking that K rate is meaningless. In the show, he’s struck out 29 to 23 free passes in his first 68 2/3 IP. Sure, it’s possible that he has undermined mountains of data that suggest the pitcher controls Ks, BBs and HRs but has little control thereafter, in the same way that it’s possible that I could have a successful major league career. Someone needs to talk that Crash Davis out of him. Strikeouts aren’t boring, and even if groundballs are more democratic, I’ll take a fascist Pedro Martinez any day.

And I’ll stand by that comment today. Crain cannot keep up his current level of success over the long term without improving his K/BB rate, mainly by bringing up the strikeouts. Someone compared him to Mariano Rivera in surrendering less hits than expected regardless of defense. Fundamentally, though, surrendering less hits is a function of striking batters out. Remember Voros McCracken’s work on BABIP, that there are three true outcomes that are defense independent: walks, strikeouts and homeruns. Crain has done exceptionally well limiting HRs, certainly a result related to his shift from a FB to a GB pitcher. His BB rate has been solid, not on par with the starting rotation, but about ¾ of a BB better per 9 than his contemporaries, Nathan and Rincon. But he stands out due to his ridiculously low 3.26 strikeouts per 9IP.

Some argue that he has improved at making his pitches harder to hit, jamming batters and preventing them from making decent contact. Indeed, if inducing infield flies is a repeatable skill, then it could have an impact on a pitcher’s BABIP, but in Crain’s case, a) he’s not inducing more pop-ups (17% of all flyballs, in line with league average), but more GBs, which don’t meaningfully prevent hits, and b) presumably, pop-ups are a similar result to strikeouts, where the hitter badly misses the pitch, but makes little contact instead of none. They should increase together.

Also, pitchers can control G/F ratio, but not where the ball goes on the field. Not even Pedro can pitch to his defense. GBs are more desirable than FBs as they don't turn into XBHs as often, but both become hits due to factors outside of the pitcher's control. Obviously, even if G/F ratios stay the same, BABIP fluctuates wildly, which undermines the basic principle that G/F ratio has much to do with balls turning into hits. Big problem: Crain has the 6th lowest BABIP among pitchers over 40 IP at .211 (ironically right next to Rivera). There are lots of good pitchers near the top of the list (Prior, Wagner, Harden, Clemens), but also lots of undistinguished ones (Matt Wise, Dave Riske, Cliff Politte). And if you think his improved G/F ratio is the causal factor that reduces his BABIP, consider that his 1.10 G/F ratio pales in comparison Silva’s sterling 1.68 ratio, but his BABIP is .089 lower, .211 for Crain to .300 for Silva. Just throwing sinkers doesn’t prevent hits. If anything, it prevents them from turning into HRs, but Crain is experiencing a beneficial phenomenon beyond that explanation. All in all, once the ball hits the bat, the pitcher has pretty much nothing to do with where it goes next, as long as it stays in the park, so Crain’s low BABIP is more luck than skill, and the its persistent low value over two seasons is a statistically anomaly.

I agree with Aaron’s argument that he’s stretching his defense awfully thin, but I think it goes beyond just walking a tightrope. As soon as Crain’s BABIP catches up with him and starts regressing towards league average, he’s due for a pretty harsh wake-up call that will result in a swelling ERA.

Thursday, July 28, 2005

The Stadium

Wrigley Field, Yankee Stadium and Fenway Park make up a baseball stadium triumvirate laden with more tradition than the Roman Catholic Church. Before Wednesday, I had only seen Wrigley: a gorgeous night where we watched Kerry Wood lose a 2-1 battle with a still-potent Wade Miller from the middle of the third-base side lower-deck. I was so impressed that I just knew that the old-timey stadiums formed a niche that I could fit into nicely. Since that day, I resolved to see the other two over the next few years as not to lose the chance later in life.

While we had planned Wednesday’s New York game for several weeks, the offer of free primo tickets to the Orioles’ game the night before came as a last minute surprise. Late Tuesday afternoon, I found out that my girlfriend’s roommate’s friend’s coworker’s parents (I kid you not) couldn’t make the game and their lower level, behind-the-plate seats had trickled into my hands. You know the kind of seats I’m talking about? The ones with cushions that the usher wipes down before you sit in them? Those seats across the aisle from former NFL head coaches wearing Super Bowl rings? (picture below). Yea, those seats. So we hopped aboard the next MARC train to Camden Station to see a great game.

I’ve been to Camden Yards several times, but seeing it back to back with Yankee Stadium demonstrated a sharper contrast than I thought I could see in two baseball stadiums. Where O’s fans inexplicably sing along with John Denver’s “Thank God I’m a Country Boy,” the Yankees have their metrosexual grounds crew doing the YMCA. O’s fans scream “O’s” over the National Anthem when they get to the last stanza’s “Oh, say does that star-spangled banner…” Not in New York. They take their patriotism so seriously that the only yelling during the National Anthem is to tell the guy who forgot to remove his hat what an asshole he is.

Frankly, Yankee Stadium can’t hold a candle to the amenities and charm of Camden Yards, which gets closer to perfection than any other new stadium I’ve visited. They have turned the surrounding area into a desirable pre-game hangout by organizing the vendors and letting you bring in the cheap food from outside (I got an enormous bag of peanuts and a Coke for $4). Inside, Eutaw Street blends in with the rest of the neighborhood, giving it a similar feel to Waveland Avenue in Chicago. There is plenty of food variety, the ushers are nice and fairly sympathetic to those upgrading from their assigned seats, and there are plenty of good tickets for under $20. On this particular night, the game itself was wildly entertaining, with a near inside-the-park homerun by Eli Marrero, a game winning HR in the bottom of the 8th by Raffy Palmeiro, a Sammy Sosa homer and accompanying hop (my first in person), and a fist fight in our section. Even the transportation is a breeze, as we made it from DC to the stadium in about two hours.

Other than the fist fight, New York doesn’t go out of its way to provide any of these little extras. We stayed in the financial district, and on the train ride to the Stadium, the operators off-loaded the 4 train twice, re-loaded it once, switched us to two other trains, and held us immobile for several delays. By the time we actually made it to the game, Joe Mauer was already batting in the top of the first, and the trip from Manhattan to the South Bronx took about as long as the previous night’s trip from DC to Baltimore. In the Stadium, the ticket takers and ushers were surly, the vendors seemed bored, and the structure was very worn down. Those seated one section over from our LF middle-deck seats couldn’t see home plate because the foul poll obstructed the view of every batter. These tickets had the same face value as those luxurious treasures in Baltimore.

Yankee Stadium even seemed to miss out on the charms that made similarly aged Wrigley Field so much fun. For one, the moved-in OF walls changed it from a quirky pitchers park to one with lots of cement between the bleachers and the field. The scoreboard wasn’t even manual, but a soulless 1970s electronic one. The lauded fans were even a disappointment, as they wore lots of Bombers’ gear, but didn’t seem all that knowledgeable and didn’t even chastise me for wearing a Johan Santana jersey and Twins cap into their home. Through the first six innings, I kept thinking that if the Twins or Red Sox weren’t in town, I might be bored.

But sometime around the fifth or sixth inning, a wild fan jumped onto the field from the seats along RF, sprinted towards the infield, and slid (safely) into second before the security hauled him off in handcuffs. The crowd finally woke up, giving him a standing ovation, and never looked back. Even though the Twins built up a solid lead behind a near-dominant outing by Santana, the fans seemed to expect a late inning comeback, and I admit that it was on my mind as well. In the bottom of the 8th, Juan Rincon had trouble finding the strike zone and gave up three runs to halve to lead to 6-3. Joe Nathan came on and gave up a 320 foot foul ball to Bernie Williams that would have tied the game if it landed 15 feet to the left, but ultimately got out of the jam and won the game.

Even though the game never got that close, the buzz from the fans was electric. Their energy and undying confidence intimidated me. What first seemed dingy started to look classic, and the charm began to emerge. The mumbling PA announcer started sounding like Marlon Brando in The Godfather. Nobody filed out for the bathroom or the concessions during a tight spot. And most importantly, the fans really got behind the Yankees whenever it mattered, without being prompted by a song or a video of a monkey. Maybe it’s the Vikings fan in me, but I’m always at least a little wary of a collapse, and these people had me convinced that it was still a game at 6-0 in the 8th. Outside of the Stadium this attitude comes off as cockiness or hubris, but here, these people are in their element, and it’s one of the more impressive baseball scenes I’ve witnessed.

Ultimately, if I felt like enjoying a sunny afternoon at the ballpark to see a game with no special weight, I’d absolutely choose Camden Yards. Somebody like Seth McClung isn’t terribly exciting, and there is a lot more to enjoy at Camden than at the Stadium. But for a World Series game? I’ll buy into the aura of the pinstripes on this one. There is truly something mythical about Yankee Stadium that could make a great game legendary.


Here are pictures comparing my Camden seats to my Yankee Stadium seats.

Wednesday, July 27, 2005

I spent the night in Baltimore watching the Orioles host the Rangers in the last Kenny Rogers start for a few weeks. Tomorrow, it's off to New York to watch Johan Santana do battle with Al Leiter in my first trip to Yankee Stadium. I'll update here on Thursday or Friday with detailed recaps and other interesting notes.

Tuesday, July 26, 2005

One Magical Summer
Position by Postion VORP Leaders

With a day off of from Twins baseball, it gave me a chance to do some digging in the statistical archives. Since I wasn’t alive for the Twins’ move to Minneapolis, or the subsequent early years, there are huge gaps in my knowledge of the team’s history. Luckily, I have lived through two World Series wins for my team, which gives me some historical perspective. But I would have loved to see the ’65 Twins go up against Koufax, or to see Rod Carew slap his way to 38 batting titles. Sadly, the best we can do is to look back at the record books, but at least there are enough stats that are adjusted for era to compare today’s Twins against the Twins from previous years.

I chronicled the highest and lowest VORP season by a Twins regular since 1972, as far back as BP keeps records on this sort of thing. Although VORP is a cumulative stat, a player can put together a pretty horrendous number pretty quickly, so I set minimum playing time requirements in order to have all regulars in the picture (I believe the all-time worst season by a Twins position player belongs to Al Newman in ’91, which doesn’t say that much about the team since he was strictly a backup). And, as a quick refresher, VORP stands for Value Over Replacement Player, and takes into account total offensive contribution over a player that could readily serve as a replacement, like a high AAA player or the last guy on a major league bench. Replacement Level is more complicated than that, and there is a specific statistical definition, but for our purposes that explanation should suffice.

Here is the position-by-position list of best and worse Twins starters (min. 400 PAs, 50 IP, Name VORP/Year):

C: A.J. Pierzynski 41.4/2003
Glenn Borgmann -4.6/1975
1b: Rod Carew 101.5/1977
Ron Coomer 0.9/2000
2b: Chuck Knoblauch 108.0/1996
Al Newman -2.3/1990
3b: Gary Gaetti 54.2/1988
Scott Leius 0.0/1992
SS: Roy Smalley 58.9/1979
Christian Guzman -20.1/1999
Lf: Shane Mack 58.4/1992
Rick Sofield -3.8/1980
RF: Shane Mack 44.1/1991
Hoskin Powell -0.5/1978
CF: Kirby Puckett 82.3/1988
Rich Becker -9.1/1995
DH: Chili Davis 50.3/1991
Paul Molitor 9.9/1998
P: Johan Santana 88.8/2004
Brad Havens -25.8/1983 (Sean Bergman, -25.7/2000)

-Judging by VORP and consistency, Rod Carew is pretty clearly the all-time greatest Twin, although I believe many fans would argue that such a distinction belongs to Kirby. Kirby was great, posting 91.9 WARP3 with peak seasons of 11.0, 10.5 and 9.2. Carew topped an 80 VORP at two positions with a 115.2 career WARP3 and single seasons of 11.5, 10.4, 10.2. Both were great, but Carew was probably greater.

-Many bad VORPs come from young players rather than the truly awful. At first, I assumed that the worst players would put up the worst VORP, but the players they keep sending out to play aren’t the least talented, but those who need seasoning. Players like Latroy Hawkins, Eddie Guardado, J.C. Romero, Doug Mientkiewicz, Christian Guzman and Dave Goltz all had full seasons below replacement level before panning out and making positive contributions. (I realize that I just made the implicit argument that Christian Guzman is not one of “the worst players,” but at the time, we may have believed that).

-Santana’s 2004 was the best Twins pitching performance of all-time, but there are lots that give him a run. Bert Blyleven put up an 80+ VORP in his first Twins stint, and Frank Viola did it as well. Brad Radke and- get ready for it- Joe Mays also put up stand-out VORPs for the Twins at some point.

-Currently pushing 30 runs of VORP, Joe Mauer could pass A.J. Pierzynski this season for the all-time catcher’s mark.

-A couple of numbers that really surprised me: Todd Walker’s 55.4 VORP in 1998, in spite of TK hating him like a fat kid hates vegetables. Also, the immortal Scott Stahoviak actually put together a pretty decent season in 1996: .284/.375/.469 26.1 VORP in 469 PAs.

Sunday, July 24, 2005

Sunshine on a Cloudy Day


After dropping three out of five in an up and down series with the Tigers and falling into a three-way Wild Card tie with the two scariest teams in the field, I'm once again left looking for some positives onto which I can cling.

One exciting development was Scott Baker's head-to-head duel with fellow future front-liner Justin Verlander. While Verlander has the greater pedigree with a sparkling college career and quick ascent through the minors, Baker has emerged as a stud in the Twins system and had a strong enough outing Saturday to beat Verlander and earn a split in the double header. Although I generally think the scout-heavy approach to player evaluation has a lot of unanswered questions, Minnesota's success is quantifiable over several years, so they clearly do something consistently better than other teams. Baker is yet another tribute to Terry Ryan's staff, as they brought in a prospect and churned out a valuable major league asset.

Another exciting occurrence from the same game was they strong outing by Justin Morneau. His slump hasn't been one of those plodding, sleepwalking types; his stat sheet has been barren since early in the season. Perhaps if he only faced pitchers with whom he shared a first name he could snap out of it, as he went 2-3, slugging a HR, a 2B and drawing a walk. It was his first HR since July 2nd, a drought that endured over 60 ABs. His patience has been shaky, yielding only 3.6 pitches per PA, and he's only hitting line drives 17.8% of the time (worse than Mauer, Lecroy, Stewart, Punto, Cuddyer and even Castro among regulars) which is a troubling number for the team's most potent bat. Somehow Torii Hunter has remained productive despite putting up even worse numbers than Morneau in these categories. But I promised I would look for bright spots, and Morneau's enduring struggles certainly do not qualify.

One player than can always bring me out of the doldrums is this season's preeminent bright spot, Joe Mauer. He has blazed through July at a .378/.462/.478 clip, making him one of the hottest offensive players in the league at the most strenuous defensive position and in the middle of a struggling lineup. Mauer leads the team in VORP by a margin of 28.9 to 22.3 over Hunter. Since VORP is a cumulative stat, that means he has been especially productive with only a little more than 3/4 of the PAs that Hunter has. Playing time hasn't been nearly the concern we expected it to be for Mauer, though, as his previously troublesome knee has held up well. Any residual pain doesn't show up in his speed stats, as he's third on the team in SBs and first in SB success rate (7 swipes in 8 tries). Defense is another strength for Mauer, as his Rate2 of 106 reinforces his spotless defensive reputation, as does the fact that he has thrown out more than 60% of prospective base-stealers. He sees 3.9 pitches per PA while hitting line drives 22.8% of the time with a team-leading BABIP of .342. All of these stats indicate that he's a hitter mature beyond his years.

Obviously I'm not the first to heap praise on Mauer, but as thrilling as its been to see him live up to expectations this soon and in spite of an unfortunate injury, I think it's even more exciting to look at where he can go over the next several years. BP's PECOTA uses historically comparable players to construct a profile of how a player's career will most likely progress with a fairly high degree of success. A high similarity score is somewhere around 50, while a player who goes down near 20 is an historically unique player. Mauer's similarity score is 18, demonstrating just how rare it is for a catcher to display such a mature skill set (patience, some power, and exceptional fielding) at such a young age. While his most similar player is Mike Scioscia, which is a disconcerting start unless you expect Mauer's greatest achievement to come as a manager. Further down the list, though, Mauer's comparables include all time greats such as Bill Freehan, Joe Torre, Gary Carter, Pudge Rodriguez, Ted Simmons and Johnny Bench. Bench and Torre eventually moved to third base, a move some have proposed for Mauer, and the others all saw more playing time at other positions later in their careers. With the knee apparently sound, it seems that we're a few years from having to answer these questions, as Mauer should remain firmly entrenched behind the plate as long as it doesn't inhibit his offensive contributions.
As Mauer grows and adds more power to his offensive repetoire, he becomes even more valuable. PECOTA projects out for five years into the future, and Mauer's Equivalent Average (which takes all offensive contributions into account) and Wins Added over Replacement Player grow all the way through the projection. As a frame of reference, he currently sports a .293 EQA, but the weighted mean projection for his EQA in his age 26 season is .312. Additionally, the statistical probability that he will have a breakout year (roughly a 20% increase in offensive contribution) grows all the way to 33% in his age 26 season. So as good as Mauer has been already, we have only scratched the surface of his tremendous potential.

My only remaining concern is that someone will give him a ridiculous nickname like Joe Cool and miss the opportunity to bestow a memorable moniker on a remarkable player. Luckily, his name doesn't lend itself to the first letter, first syllable albatross (J-Mau is a disaster). Since he exhibits such a quintessential skill set and seemingly great personality, I favor a name that presents him as an ambassador for the sport, something along the lines of Baseball Joe or Joe Longball if he becomes a HR threat later in his career. Any suggestions here would be appreciated, because someone as unique as Mauer shouldn't suffer from the dumbing down of sportswriting.

Saturday, July 23, 2005

ESPNNEWS is reporting that San Diego will deal Phil Nevin to Baltimore for Sidney Ponson. My snap judgment is that Baltimore must have decided to accept the proposed Julio/Bigbie/Penn for Burnett/Lowell trade since they acquired the extra OF bat and gave up their 5th starter. That leaves them with a pretty potent lineup that could look as good as this:
1. Mora 3B
2. Roberts 2B
3. Tejada SS
4. Nevin LF
5. Palmeiro (the RESURGENT Raffy Palmeiro) 1B
6. Lopez C
7. Gibbons DH
8. Sosa RF
9. Matos CF

Sub in Lowell for Gibbons, and that's pretty dangerous.

I'm now scratching my head for the second time in an hour regarding a Kevin Towers trade. Nevin was almost traded for Griffey a year and a half ago; has he fallen this far? Ponson is a 5th starter or a swingman at this point in his career, not the market setter he was a couple years ago when he was dealt to SF at the deadline. My only guess is that Adam Eaton's injury is worse than anyone knew, and they became desparate for starting pitching while remaining confident in Xavier Nady's bat to replace Nevin.

Market for Romero Heats Up

One brief trade market update today, the day after the Joe Mays Demise (JMD) set in for the remainder of the season. Jayson Stark reports that Joe Randa is off the market and J.C. Romero is a hot commodity (ESPN insider required).

First, losing out on Randa is a pretty huge relief. Given the choice between the faltering Mike Cuddyer and an empty .300 hitter who hasn’t hit .300 since 2000, I think I’ll default to the youth movement, because there is some hope for improvement. Anyway, Randa is reportedly headed to San Diego, where the Padres needed to replace a slap-hitting but pop-less third basemen for their pennant run. Apparently, they felt that the best alternative to Sean Burroughs was an older player who has never won who has similar trouble hitting for power, and who will probably hit less singles in Petco. I don’t have a problem with cutting bait on Burroughs for the stretch run, but they should at least have an alternative that is clearly better.

More good news on the Romero front, as an official from another team insists that they will not trade the lefty for a “rent-a-player,” meaning Mueller-for-Romero won’t happen in its current form (collective sigh of relief). Stark had little more to say about Romero, other than idly bandying about the names of other infielders on the market, such as Alfonso Soriano and Shea Hillenbrand. He also pointed out that the market for lefty relievers has dried up, leaving the Twins with an increasingly valuable commodity.

Friday, July 22, 2005

High Five Friday

While Junior Griffey’s 2005 line of .290/.371/.546 looks suspiciously like his career line of .292/.377/.559, restoring his trade value to a meaningful level, I’d still be surprised to see the Reds trade him before the deadline. Remember that he signed his big contract at a hometown discount, so he’s worth a lot to them if he’s playing at his normal level. He still has tremendous drawing power, and is probably the second best player in the five man logjam in the OF and at 1B for the Reds. Ideally, they would be able to trade Sean Casey’s salary for the next two years for a middling prospect, or a rock, but they’ll probably have to settle for getting rid of one of the OF. If I was a betting man, and I am, I would bet on Pena based on the Reds’ track record of moves. Pena is the least proven commodity of the bunch, leaving the paranoid Dave O’Brien with three outfielders of whom he can be more certain. A big swinger, he seems like he would be a good fit in another NL Central bandbox like Houston.

---

As if Livan Hernandez needed to solidify his place in my heart, he now joins the elite ranks of the completely insane athletes. Throwing 250 pitches per start makes him really fun right away, but leaving a game, then threatening to have elective surgery in retaliation for a mysterious offense from an anonymous team source that will be revealed after the season? One or two more outbursts like that and he’ll jump into my upper echelon of athletes who are so crazy I can’t help but love them: Rickey Henderson, Ricky Williams, Ron Artest, Rueben Patterson and the greatest of all time, Mike Tyson. For those of you who don’t follow Livan, he employs a unique style of pitching that went out of style sometime around the ‘50s. He doesn’t show his best stuff to the majority of the hitters, saving it for the other team’s sluggers. Supposedly, this approach is the reason he throws so many innings without injury. Now that he has decided not to have surgery to fix his knee, I think it’s fair to say that Livan wears his war wound like a crown. With any luck, he’ll soon have a son and name his Jesus, because he likes the name.

---

Johan Santana was far from exceptional on Thursday against the Tigers, striking out only 3 on 5 shaky innings to kick off the series. Maybe he was on cruise control with a big lead; it’s hard to say what effect that has on a pitcher’s psychology, but for those looking for a repeat of last year’s second half: don’t hold your breath. That player doesn’t exist. He was simultaneously channeling Sandy Koufax and a young Roger Clemens, which simply has no precedent. If we have a 3.50 ERA lefty who can approach the league lead in Ks for the rest of his contract, I’d call it a bargain with the current SP market.

---

I feel like we’re about to hit stride at the right time. The Twins don’t have a great record in 5-game series the last few years, but those were mostly in October, not mid-July. We got lucky a couple nights in a row against the Orioles, and if they can carry over some of the confidence as they seemed to on Thursday, it would help put them in better postseason position. Although I’m speaking wholly on intuition and have nothing solid to justify my optimism, I felt hopeless about this team a week ago, and that despair is rapidly leaving. If they beat the tough lefty Maroth tonight behind Mays (in what may be his last start for the Twins), it would be four in a row against decent competition. It’s hard to argue that a team on a four game winning streak is in dire straits.

---

I know it isn’t all that important, but could the Twins front office target more predictable players? Rick Reed, Bill Mueller, Bret Boone and Todd Jones somehow seem to me to have had pretty much the same career. They were all decent but boring for a long time, spiked for a year or two to become one of the better players at their respective positions, then fell in a funk before the Twins went after them. Perhaps I’m reaching here, but they Boone, Mueller and Reed even look alike. (Hilarious side note: the first three pictures of Reed on my image search were pictures of people running with titles such as, "X rounds the bases after homering off of Rick Reed." What a legacy.)


Thursday, July 21, 2005

Twins Trade Notes and Check Swings

The newest whispers swirling in the Twins’ rumor mill have to do with the Mays & Romero for Millar & Mueller scenario. Yesterday, I panned the Mueller for Romero possibility, and given my proclivity for avoiding 33 year-old first basemen with a sub-.400 SLG, one may think this only makes the trade worse. But not so fast, as I think this trade could help the Twins given the right accompanying moves.

First, let’s look at what we get. Mueller isn’t thrilling, but he has a high OBP and would be better than Cuddyer at 3B the rest of the year. He has Cuddyer beat in MLVr .063 to -.05. As neither is an offensive stud, the main value would come in Mueller’s glove, since he has been an above average fielder for several years while Cuddyer fields as if he’s made of concrete. Millar is marginally better than Sweet Lew at DH, and could take some ABs from Mourneau against tough lefties or Mariano Rivera.

More important is what the Twins give up, what I see as addition by subtraction. I’ve commented several times on Joe Mays and the regression I expect from him in the second half. Thus far, he’s remained effective despite weak peripherals, but I suspect that Scott Baker would do more good for the rotation for the rest of the year. At very least, he can strike some batters out. Also, Romero has been wildly inconsistent for the last few years. A good few months this year have made us all forget how infuriating he was last summer, necessitating a AAA stint due to complete lack of control. True enough, he’s the best lefty, but Romero, Nathan, Rincon and Crain have all been comparably effective against lefties this year, and there are lots of live arms in the system to fill the hole. Keeping a situational lefty around is not a necessary condition for a successful bullpen, as the Nationals proved this year when Joey Eischen was injured, and the Angels have proven every year since 2002. Finally, just think of Mays and Romero’s value relative to last year when Romero was in the minors and we didn’t know if Mays would ever pitch again.

To summarize, I think this trade is a small upgrade at three positions and a neutral shifting of deck chairs at a fourth. The trade would probably modestly help the Twins’ offense, but not make more than a win or two of difference.

---

Will Carroll reports that Justin Morneau may have blurred vision. It’s surprising that the effects of a concussion could last this long, but the symptoms are consistent with the injury. Maybe some rest time would help him fully recover, but I’m not a medical expert; just a sympathetic former concussed fan. As one would expect, he’s struggling against righties and lefties with possibly bad vision, making him proportionately less effective against both halves of the platoon split. The lesson here is to never underestimate the power of a speeding spheroid to the skull.

---

A little bit further south in the Central division, the “Greinke is the next Maddux” crew seems to have jumped ship after a poor 2/3 of a season from the Royals ace. But Greg Maddux wasn’t always Greg-freaking-Maddux, either. In his first full season, 1987, Maddux went 6-14 with a 5.61 ERA, 101 Ks and 74 BBs in 156.2 IP. So far this year, Greinke has kept pace, going 3-11 with a 5.66 ERA, 65 Ks, 30 BBs in 110.2 IP. Odds are Greinke will never win 300 games, but Maddux went on to win 15+ for the next 17 years and counting after a worse start, so don’t count Greinke out yet.

---

The White Sox are after Billy Wagner to solidify the bullpen with Takatsu DFA’d and Hermanson on the shelf, apparently with a swollen luck gland tightening up his lower back. Wagner is not what he was in Houston, and has become extremely injury prone. For Chicago to commit to his salary would be to commit to their current core of players for several years, which delights me. If Garland, Podsednik, Buehrle, etc are their stars going forward, I will look forward to competing with Detroit and Cleveland for the next several years. Forgive me for discounting this season, but remember, the 2001 Mariners haven’t been very good since, and the organization has collapsed under the weight of commitments made to players having concurrent career years.

---

While on the subject of profound evil and swollen glands, the Great Giambino continues to mash in the Bronx, bombing two more in Texas last night, and keeping my fantasy team afloat. I find that the best way to deal with your worst enemies is to embrace them, especially when they get acclimated to hitting off the juice.

Wednesday, July 20, 2005

Christmas in July

For a transaction fiend like me, the anticipation leading up to July 31st is truly more exciting than the few days before Christmas. While I haven’t been a present shaker for years, I cannot help but imagine every derivation of every possible trade for the best players on the market each July. For a long time, I had to do so with an air of detachment, as my favorite team hadn’t the resources nor the cause for a big-name deadline acquisition. These days, however, the Twins are struggling in the midst of a playoff race, and the only question is if Terry Ryan has the panache to complement his rickety waiver wire pickup with a dramatic difference-maker. Just like the days after Thanksgiving, I’ve made a wish list for the trade deadline, but this one includes only the players I would most like to see with the Twins in the next couple of weeks, mindful of the role they would play, salary, opportunity cost and long-term commitment. I also tried to stick to players who have been mentioned in trade talk.

1. Adam Dunn: Sure, there are considerable drawbacks. First, Dunn’s price-tag is higher than almost anyone on the market, and the Reds front-office has spent the season acting like a group of petulant teenagers, holding grudges and initiating a childish power struggle (banning EZ chairs from the locker-room, demoting Austin Kearns). Also, experts have projected Dunn’s arbitration number to go as high as $8MM next season, higher than any Minnesota position player. Some people even argue that his body type will cause an earlier than usual collapse, and that his peculiar skill set will prevent him from being a franchise player.

Lies! Who dares blaspheme the mighty Dunn? To answer the first contention: yes, Cincinnati management has been moody and difficult, but the unpleasantness must be tolerated for such a payoff. The Twins have such organizational depth that they can afford to spin off a few very-goods for one great. Think of a package along the lines of Boof Bonser, J.D. Durbin, Ryan Bowen and a low-minors position player. The Reds get immediate help to their rotation/bullpen and a catcher who is probably better than Jason LaRue right now. With Scott Baker granted Emeritus status among minor league pitchers, Durbin’s health problems become expendable. Bonser is having a breakout season, so his value is at a peak. In return, we get one of the game’s great mashers. Eight million should not be seen as a burden, but a bargain for such a great talent. Think of it as Kris Benson money, or, dare I say, Eric Milton money adjusted for inflation. Either way, he’s worth it. Look beyond the 40 homer seasons and 50 homer potential. Even look beyond the 100+ walks. Courtesy of Baseball Prospectus, look instead to his future forecast. He projects to about 6 wins over replacement level by himself every year for the next five. He has a collapse rate of zero, unheard of for someone only 25 years old, for the next three years. He even projects to improve his EQA (a number that takes into account overall offensive contribution, adjusted to look like batting average) over .320 and as high as .330 for the next five years. He is a young stud who is only approaching his prime.

2. Mike Lowell: While the Twins don’t need an OF/1B like Dunn and would be obliged to squeeze him in, Lowell’s value to the team comes mostly in his ability to play 3B. Mike Cuddyer is approaching never-was status, and his defense has been worse than anyone has mentioned, with a Rate2 of 84 at 3B, meaning he costs the team 16 runs over an average 3B every 100 games, adjusted for league difficulty. Lowell hasn’t been a shining star this season either, but he’s a known quantity who will almost certainly rebound. In five full seasons as a regular, he has never fallen below a .340 OBP, .440 SLG, or a 101 Rate2 defensively. Cuddyer slugged exactly .440 last year in 318 ABs, the closest he has ever come to those numbers. Lowell’s financial commitment- about $7MM for each of the next two years- makes him undesirable to the Marlins, but really is not that bad for a proven commodity just past his prime. He will probably never recapture his peak years during this contract, but he has little chance of continuing the current implosion. The upside is that the Marlins are so willing to shed his salary that he can be had cheaply. They want high-minors pitching, and we have a ton of it.

3. A.J. Burnett: If the Marlins needs line up for Lowell, then they must also line up for Burnett. The Twins would likely part with Lohse in a deal for Burnett, which would make room in the rotation. Just like Jose Jiminez and Eric Milton, Burnett made a name for himself by throwing a no-hitter early in his career. Unlike those other two, he still has a promising future. He has the dual tags of “injury prone” and “uncoachable,” which may have some warrant, but take little away from his nearly 9 K/9, improving walk rate, and electric stuff. He’s a free agent at the end of the year, so there is little financial commitment, but the runs he prevents this year could go a long way toward securing the wild card.

4. Aubrey Huff: Huff, like Lowell, is performing well below his established level of performance, but should steadily improve as the season goes on, and remain at a higher level in the future. He is nearly three full years younger than Lowell, so he is even less likely to be in the midst of a collapse, and, at 28, may still have his career year left in him. Although he has a reputation as a defensive sieve, his career Rate2 at 3B is a very tolerable 96, and he’s been an above average first-baseman. This trade makes a ton of sense to me, but the reason it isn’t higher on the list is that Tampa Bay GM Chuck Lamar is purportedly very hesitant to finalize a deal, fearing that it will ruin his reputation after last year’s Zambrano-for-Kazmir coup. I think Chuck Lamar should worry less about ruining his reputation, as 10 horrendous seasons and a bleak future have already done that.

5. Kevin Youkilis: He’s cheap, young, talented, and plays a position of need for a team that wants to make a deal. The downside here is that Youkilis probably will not be available. I include him on this list more as an alternative to the rumored Bill Mueller swap involving Romero. Analysts were once concerned about Youkilis’s lack of power, but he’s actually flashed more wood since arriving in the majors to go with his Moneyball title as the “Greek god of Walks.” He even has value in the field, posting a stellar 111 Rate2 in 83 games as a major league 3B.


Sock List (presents I don’t really want):

Joe Randa: He’s putting up his best season in years after shifting to a much better hitter’s park. He insists that he is happy in Cincy and doesn’t want to play anywhere else. He’s already 35 years old and showed signs of his natural regression each of the last four years. Forgive me if I’m not all that excited about giving away prospects and placing our post-season hopes in The Joker.

Bill Mueller: Mueller is another player who is past his prime and has inflated statistics from an offense-oriented home park. While he can play third base, he doesn’t really fill a need for the Twins offensively as another decent AVG hitter with little else to offer at this stage in his career. Factor in his achy legs and he doesn’t seem like an exciting option.

Bret Boone: Can the PTBNL in the Bret Boone trade be Bret Boone? Just asking.

Tuesday, July 19, 2005

OPS-HFAr and Winning

As promised, today I’m back on the subject of HFAr with some graphs to back up my arguments. The purpose of the math here is to demonstrate that HFAr can be a meaningful predictive tool. Sure, it is fine to describe a situation past, but a statistical model that can tell you something about another trend is more important. Although runs scored and runs against obviously work best for determining winning percentage, and would be a better model for prediction than OPS, I dove headfirst into calculating OPS-HFAr for all 30 teams because I thought the lower correlation between OPS and winning percentage would make it easier to demonstrate the effectiveness of HFAr.

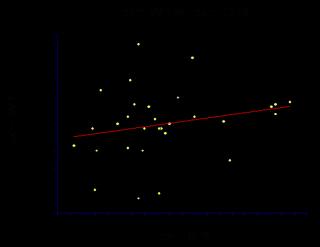
First, let’s take a look at the graph plotting winning percentage as the dependent variable of a team’s overall OPS. (Apologies for the image quality, the host will not allow high quality images or images with text, but it should still be demonstrative.)


This graph is messy, the points are scattered all about, and it doesn’t show a statistically significant correlation. To use yesterday’s example of the White Sox, their point is far above the linear approximation, but not far enough to the right. They’re offense is unspectacular, but they have an extremely high winning percentage. The r-squared value for this graph is only about 0.0547, meaning that team OPS only explains about 5.5% of the variance in winning percentage. The correlation between them is 23.39% (read: weak).

Naturally, HFAr will be a better approximation than OPS by virtue of accounting for run production and prevention. The question is: a better approximation of what? Since teams with a high HFAr should have more success at home, let’s first look at HFAr on the X-axis against home field winning percentage on the Y-axis. Using pure winning percentage would not suffice, since a team with an 0-45 road record would have a terrible W%, and could have a high HFAr.


This graph is a little better. There is still no central cluster, but the r-squared value is up to 18.5% and the correlation to 43.01%, meaning that a team with a HFAr should have a better home record than a team with a bad one.

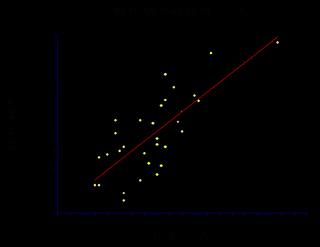
But that measurement is still insufficient, as HFAr doesn’t predict a good home team, just a better home team than road team. Colorado, for example, is not a very good home team, only one game over .500, but they have a very high OPS-HFAr because they are so brutal on the road. Thus, the appropriate measure would be one that looks at how much better a team is at home than on the road. Here I’ve plotted OPS-HFAr as the independent variable once again, but now the dependent variable is home winning percentage minus road winning percentage (WPh-WPr) to paint a picture of the teams that truly get an advantage from their home field.


It’s still not perfect, or even really all that good, but the r-squared is up above 50% (56.86%) and the correlation is 75.4%, meaning that the two values move together about three quarters of the time. That’s not bad starting out with a stat that shows almost no correlation to winning. At very least, we can draw the conclusion that OPS-HFAr will predict a team’s increased winning percentage at home much better than OPS can predict a winning record.

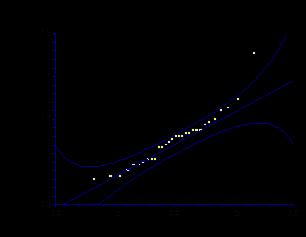
Finally, here’s a graph of the normal distribution of OPS-HFAr:


The data point far above the rest of them is the insane split of the Houston Astros. I alluded to how much more of an advantage they had yesterday than any other team had an advantage or disadvantage. The standard deviation of OPS-HFAr for this data set is 0.0931, putting them 3.25 standard deviations above the mean. The chances of a team performing at that level are fractions of 1%. To me, it seems that the implication would be regression to the mean, as they find a way to hit on the road and cool off at home.

Monday, July 18, 2005

HFAr through the Majors

The author’s job is to get the reader interested. If I’m writing a book, the first chapter needs to be worthwhile or you’ll put it down. When I introduced the Home Field Advantage ratio, it needed a snappy kickoff, or everyone but the most analytically-minded would forget about it by the end of the article. I decided to apply it to analyzing the Nationals’ success right off the bat, and, in so doing, I left a lot of ground uncovered. Today I will go back and retrace some of my steps to explain how HFAr functions as a league-wide tool.

Even though the Nats example gave a pretty demonstrative case and helped me make some of the intricacies of HFAr clear, it may have been in some ways misleading. Perhaps the most important aspect left unclear is that most teams have an HFAr greater than one for important categories. In other words, home field advantage is real. If you don’t believe me, look at the standings, where 22 of the 30 MLB teams have a .500 or better record at home. League average varies from stat to stat, but HFAr will usually average somewhere over 1.1. Also, it must be clear that there is no single HFAr stat to explain how well a team performs at home relative to road performance; it can only explain specific statistics. The strength that counterbalances this particular weakness is that any HFAr measure simultaneously takes into account production and prevention. Much like the Pythagenport standings encompass runs scored and runs allowed, each HFAr is a ratio of how much of a certain stat a team produced to how much it allowed.

Since the correlation between run differential and winning percentage is already well established, I decided to go another route and examine how OPS impacts winning at home and on the road. If OPS was a perfect measure of offensive production, OPS-HFAr would fully explain the difference between a team’s performance at home and on the road. Since OPS is flawed, OPS-HFAr cannot fully explain run prevention or run production differentials, missing by the margin set by the OPS limitations. Today I’ll go over some of the OPS-HFAr data for the major leagues, and tomorrow I will show some graphs that demonstrate how much more effective HFAr is at explaining home-road winning splits than OPS.

OPS-HFAr rankings:

Houston: 1.43
Colorado: 1.27
Atlanta: 1.24
Washington: 1.23
New York (A): 1.20
--
17. Minnesota: 1.12
--
25t. Philadelphia: 1.04
25t. Kansas City: 1.04
27. Anaheim: 1.02
28t. Arizona: 1.00
28t. Seattle: 1.00
30. Chicago (A): .99
Mean: 1.127
Median: 1.13, 1.14
Mode: 1.14

At first, it seemed to me that hitter’s parks would populate the top of the standings, because so many teams hit extremely well at home and struggle on the road in Colorado fashion. As my Nats study indicated, however, teams have a very difficult time adjusting to an extreme pitcher’s park, hence the high marks for Washington and Atlanta. And sure enough, the top three teams in Winning Percentage at home are all in the top four in OPS-HFAr, Washington, Houston and Atlanta.

The reason OPS-HFAr is better at explaining a winning record than OPS alone is that it takes pitching and defense into account. The White Sox have only a .739 team OPS to go with their mind-blowing .678 Winning Percentage, but they prevent other teams from having a high OPS by playing two CFs and pitching above their collective established level of performance. I will have more to say about correlation tomorrow as the graphs do a better job explaining regression than I can do in words.

A couple of other interesting notes:

-All of the most extreme home or road W% are teams with obscene losing records on the road. No team has posted a .700 record at home or on the road, but Colorado (.163), Cincinnati (.262), Tampa Bay (.234) and Kansas City (.289) have all fallen below the correlative .300 W% on the road, with Houston (.304, but climbing) within smelling distance.

-Speaking of Houston, it is strange to see a team with such a tremendous home-road split and an overall record near .500. Intuitively, a team is either good or bad, and a good team would win at home and on the road, while a bad team would lose at home or on the road. Home field advantage can explain a bad team playing well at home, like the Rockies, by giving them a repeatable leg up. But a team that isn’t great and isn’t terrible finding a way to be great at home, but remain terrible on the road (.682 to .304) is surprising.

-Only CHA and SEA post a home field disadvantage in terms of OPS (SEA rounded up to a 1.00 HFAr), and both are slight. Five teams, though, have found a way to have a higher road winning percentage than home, including Chicago. The other four have performed well at home, but not won games. San Francisco is the most egregious offender, approaching league average with a 1.10 OPS-HFAr, but still having a .435 home W% to .444 on the road.

-This research demonstrates just how similar Cleveland and Detroit have been this year. The teams’ OPS-HFAr is identical out to four decimals, and they are within ½ a game at home and 1.5 games on the road.

-The Twins don’t show any strong tendency toward home or road dominance. Their OPS-HFAr of 1.12 is just a tick below league average, meaning their home field advantage is still there, but the baggy isn’t the game-breaker everyone has always made it out to be. I will be interested to see in looking at old data if their advantage changed when their speedy team switched from Astroturf to Fieldturf. Finally, in the Twins’ case, most of the advantage comes from improved hitting at home. Their opponents’ OPS drops from .745 to .721 in the Metrodome, while the offense sees a much greater gain, going from .695 to .752.

-Although it would have been prudent to check it out right away, my hypothesis about the Nationals holds true for these rankings, as they gain nearly as much from playing at RFK (about 11%) as the worst teams lose. That statement makes Houston’s achievement(?) that much more astonishing.

And in case you’d forgotten, I’ll have much more on the subject up on Tuesday afternoon.

Sunday, July 17, 2005

Check Swings

According to the Baseball Prospectus Batting Averages by Position chart, NL first basemen have had the highest OBP and SLG of any position. The much maligned AL 1B are actually 6th with no big surprises ahead of them. NL 2B has the only notable outlier among the big three rate stats with a .347 OBP, about .20 above league average.

The only really surprising statistic comes from AL PH, who are statistically the worst non-pitcher group of hitters. That means that over a large sampling, the manager would be better off never pinch hitting in the American League, because they are worse than any position. The tension here comes from leverage, as pinch hitters are often used against particularly effective situational relievers making their ABs more difficult. On the other hand, it seems to undermine the conventional wisdom that it takes a special type of hitter to pinch hit, since they’re failing miserably to the tune of .212/.310/.315.

----

Whomever had 11 in the office pool for “At-Bats before Brett Boone’s first hit as a Twin,” congratulations, you outlasted the rest of the field for the win. That’s all for today; I’m taking it easy on my birthday.

Saturday, July 16, 2005

Capital Gains
The Nationals and Home Field Advantage


Whenever a team exceeds expectations, analysts race to the keyboards to offer explanations for the success. If a team makes a dramatic turnaround with a similar core of players, as is the case with the 2005 Washington Nationals, the explanations can get pretty gooey and intangible. One of my favorites is the idea of Home Field Advantage. Intuitively, it seems reasonable to say that a team would play better in a familiar environment, with each player sleeping in his own bed, and so forth. However, precious little data explain the effect that a home stadium can have a team’s success. Obviously, the Red Sox are better at Fenway, but how much of that success is attributable to the fans, how much to Theo Epstein for constructing the right team for the park, and how much to the effect of being comfortable at home?

I’m not ready to dive all the way into the intangibles just yet, but I have devised a toy that can help to quantify just how much advantage a team gains from their park by comparing them to themselves away from home. I don’t mean a comparison of how many homeruns, for instance, a team hits at home versus on the road; that’s nothing more than a park factor and says little about an actual home field advantage. Instead, I’m looking at a ratio of ratios: the ratio of home runs hit by a team at home to their opponents’ HRs divided by the ratio of HRs hit by that team on the road to their opponents’. I’ll call it the Home Field Advantage Ratio:

HFAr= HomeH/VisitorH / HomeA/VisitorA. Where H stands for the home team at home and A stands for the home team everywhere else (away).

An HFAr of one means there is no home field advantage; the team hits the same number of home runs relative to the opponent at home and on the road. A number greater than one means that the team has an easier time hitting home runs at home, thus a home field advantage. Anything below one means they are doing poorly at home, and not because of a park factor, as the other team would be subject to that as well. The ratio doesn’t have to be for HRs; it works equally for any stats, which may be especially useful to see how teams gain the upper-hand at home. Also, it varies as you would expect: with each HR hit at home the HFAr for HRs increases. If the other team hits a HR in the home stadium, HFAr decreases. Similarly, if the team hits a HR on the road HFAr decreases because we cannot attribute home-field HRs to being at home if the team hits lots of them everywhere. Finally, if the opponent hits a HR when the team is on the road, it increases HFAr by decreasing the team’s overall HR ratio, making the HRs hit at home relatively more noteworthy.

As I mentioned earlier, the Washington Nationals are a particularly interesting case. They stand atop the NL East at 52-38 coming into action on July 16th, largely due to their 30-13 home record (that’s a 22-25 road record if you don’t want to do the arithmetic). Their record is particularly interesting because they have a losing run differential- 362 RS, 369 RA- despite being 14 games over .500, leaving analysts to frequently postulate that they have a unique home field advantage in the spacious luxury of RFK stadium. Using HFAr, we can look at exactly where that advantage originates in terms of performance. Here are some of the most important HFAr numbers for the Nationals. (Note: Because I’m working with ratios, it doesn’t matter that the Nats have played more away games than home. The numbers standardize themselves when divided).

HFAr:

2B: 1.225
3B: 3.75
HR: 1.669
BA: 1.133
OBP: 1.149
SLG: 1.304
SB: 1.44
K: .723

Don’t look at the positive 2B HFAr and say “Oh, they’re better at hitting doubles at home.” That’s not actually true, they hit more doubles on the road, but their opponents hit a lot more doubles when the Nats are on the road. What you should really say is, “Oh, they’re better at hitting doubles at home relative to their opponents.”

A couple other interesting bits came up in these calculations that might help explain the Nationals’ home success. For one, they definitely show some of the home road splits you would expect for a team in a pitcher’s park, going from .251/.330/.386 at home to .264/.325/.403 on the road for a little improvement. In fact, despite the great home record, they are actually last in the major leagues in runs scored at home. The real splits are in their opponents’ stats: a putrid .240/.312/.329 at RFK, and a less Guzmanian .286/.353/.448 everywhere else. In other words, the Nats’ home field advantage comes from everyone’s bat turning into spaghetti upon entering RFK. Since HFAr doesn’t prefer a run scored to a run prevented, one could just as easily attribute the success to Washington’s pitchers stepping up at home. Either way, their opponents have been hurt far more by the park than they have.

Also, the 2B, 3B, HR and SLG numbers are much bigger than the AVG and OBP ones, meaning that other teams are able to scratch out singles nearly as well, but not get extra bases. This data bears out some of the conventional wisdom about home field advantage. For example, at home, a player knows when to stretch a double into a triple when hitting the ball into the RF gap, whereas he might just stop at second if he was uncertain of the OF contours. Also, power hitters may learn to hit more HRs in their home park (Jose Guillen aside) by tailoring their swings to the stadium’s dimensions. But beware of the sampling here, as the huge HFAr for triples is the result of only 4 three-baggers by visitors all year. The numbers may also level out more as teams take their second, third and fourth trips through DC and start to become accustomed to the confines.

As a final note, the HFAr figure for Ks of .723 still means they get an advantage at home, because teams try to avoid strikeouts. In the simplest terms possible, 12 Ks are better than 24 Ks for a hitter just like 24 HRs are better than 12 HRs. You could just as easily flip the numbers around and view it from a pitcher's point of view (desiring Ks) and get an HFAr of 1.38. Either playing in RFK helps their pitchers strike out their opponents more often, or helps their hitters strike out less often. Judging by the raw stats, it appears to be the latter.

None of this information provides conclusive proof as to why teams, particularly the Nationals, play so much better at home, but it gives a starting point for the discussion. At very least, we now know now much better they have been at home over the course of this half-season, and some of the differences allow us to make more educated guesses as to why that may be.

Friday, July 15, 2005

I changed the settings so that anyone, member or no, can post comments on the blog. We're an egalitarian bunch here at MBC, but I tend to speak of myself in the plural. Feedback appreciated! Also, thanks to Aaron Gleeman for mentioning me on his much more popular Twins blog, www.aarongleeman.com.

Check Swings

One bad outing does not a failed closer make. Indeed, Curt Schilling gave up a game-losing homerun to Alex Rodriguez, but let’s use some restraint before we send this portion of his career to the gallows. First, he has not seen big league action since April 23rd and has pitched scarcely few innings to anyone since then. Forgive him for not having his best stuff in his first inning back from the DL; it’s hardly a unique case. Furthermore, I don’t buy the argument about a closer’s temperament, seeing as Schilling is one of the more tenacious pitchers in the game with a powerful pitch arsenal to match. If Eric Gagne, Joe Nathan, Dustin Hermanson, Eddie Guardado, Jason Isringhausen, John Smotlz and Mariano Rivera can go from middling starter to dominant closer, there’s no reason, with time and commitment, Schilling can’t do the same. Even if it’s just for one pennant race.

----

Color me ambivalent about the Joe Kennedy trade. A guy with an ERA over seven in any stadium makes me apprehensive, and his third most similar player for his career so far is Darrell “Suitcase” May. I’m most bothered by the fact that, for me, Kennedy is eternally linked to Kyle Lohse. They both came up mid-season in 2001, began with two blazing starts, then slowly faded back to league average or worse. Ever since, each has seemed something of an enigma yet to fulfill his potential. I suppose he’ll take the rotation spot occupied by Kirk Saarloos and his 2.55 K/9, which can’t be a bad thing. More ominous is the thought that Kennedy will become the resident 12-to-6 slinging lefty after Barry Zito’s departure, perhaps at the trade deadline. We’ll have to wait to see how that one develops.

----

I’m at least a little disappointed by the Nationals’ acquisition of Preston Wilson. It seems like the trade is proof of Jim Bowden’s hyperactivity more than anything else, as Marlon Byrd and currently injured Ryan Church have been reasonably productive as a LF platoon. Moving Wilkerson to first as a stopgap for Nick Johnson’s healing heel is a clever utilization of versatility, and results in the always fun leadoff first-baseman. I’m worried, though, that Church will never get a chance to prove his value now that he’s possibly the 5th outfielder. After a good-not-great minor league career and a house afire couple of months under the giant Tony Armas Jr. mural in leftfield, it’s unclear what the Nats have. With Byrd settling somewhere between his strong 2003 and abysmal 2004, giving Church some ABs with Byrd as the only insurance isn’t a terribly risky gamble. My main fear, that the team spent their trade capital on a CF instead of a SS or RP, is probably unfounded given Bowden’s attention span. They’ve already brought disgraced Yankee Mike Stanton on board to help ease the reentry process for Joey Eischen, and will probably move on several more players before the break.

Thursday, July 14, 2005

Second Half Notes and Wild Card Projections

If the AL playoffs started today, the Red Sox would host the Rangers in a hitter’s-park slugfest and the Yankees would eke out the Wild Card to earn a trip to Jacob’s Field where the Indians would host their first playoff game since 2001. At least that’s how it should be, according to the Adjusted Standings at Baseball Prospectus, which essentially adjust for luck. First order records adjust to the standard Pythagenport run differential winning percentage (using 1.83 as the exponent instead of Bill James’ standard 2). Second order adjustments “fix” the overall runs scored/allowed by setting them in line with a team’s component performance, while third order adjustments take into account strength of schedule. In other words, all else equal, three of the four current playoff spots would go to the wrong teams.

Of course, what’s fair is not always what’s right, and as a Twins fan, I know not to complain about teams finishing above their run differential predictions. With that thought in mind I’d like to take a look at some second half possibilities, and take my own educated guess at who will be playing meaningful games in October.

Minnesota: I spent a lot of breath (figuratively) over the last few days discussing the prospects of the Twins’ starting rotation and infield. To recap, it looks like Joe Mays has performed above what his K and BB rates would indicate, and is due for some regression, especially as the IP pile up on his bionic arm. Johan Santana probably will not stay on the pace of the team’s second best pitcher, and ought to put up a performance more commensurate with being the league’s K leader. The rest of the rotation has performed at a reasonable level, and I won’t predict sweeping changes for any of them barring injury.

As for the infield, read Tuesday’s post where I explain how Boone, Punto and Cuddyer/Rodriguez can save upwards of 20 runs over an infield that includes Rivas, Castro or both. While the “If Gardy would just start X, Y, and Z in the field” mantra has become an ineffectual broken record, it seems as if the organization has started making commitments to the right people. With Morneau currently at the low end of his ability, it is not unrealistic to think that the infield could add enough offense to account for a little more than two full wins in the second half.

The first-half outfield produced Torii Hunter’s mild resurgence, but any backsliding there will likely be offset by small OBP improvements by Stewart and Ford, with Jones picking up some of the SLG slack. I don’t expect any of the four to have drastically different second halves, and should offer a similar offensive contribution.

I mentioned on Monday that Jesse Crain needs to improve his strikeout rate, which I can now statistically reconfirm. He is currently the 5th Hit Luckiest pitcher in the Major Leagues in terms of Batting Average on Balls in Play with opponents hitting a paltry .192 after making contact off of him. However, even if he starts losing his tug-of-war with the laws of physics, the rest of the bullpen can help pick up the slack. Mistaken All-Star Joe Nathan has been mildly Hit Unlucky to the tune of a .305 BABIP while Juan Rincon missed 10 games for his “substance” suspension; both will have more time in high leverage spots than Crain in the second half.

At the break, the Twins are on pace to finish with about 90.5 wins. I think their run prevention pace- 2nd in the AL- is sustainable with Johan’s improved performance offsetting small regressions elsewhere. With the offense contributing a couple more wins, I think an optimistic but reasonable projection could put the twins at 93-69, almost certainly not enough to win the Central for the 4th straight year, but in good WC position.

Cleveland: The neglected competitor from the Central still has not totally sold me, despite having the best component stats in the division. It seemed to me at the season’s outset that most of their key offensive cogs had pretty much maxed out last year. Even though Boone and Blake have been abysmal this season, they have both recovered somewhat in recent weeks and cannot be expected to offer tremendous contributions at their best. I would be shocked by Peralta slugging over .500 all season, or Hafner making a run at a VORP of 80 (currently 44.4). Just like last year, I think Cleveland is a good team, but they have ground to make up, and I don’t see where they can expect that much improvement. They also have to deal with their young players such as Peralta and Sizemore playing a longer season than ever before. Even with their brutal start, they’re on pace to win 86.5 games. I’ll be generous and say 87, but I really don’t see where they are going to get the runs to get to 90+ wins.

Texas: Here’s a good offensive team taking advantage of a great offensive environment (RS park factor of 124) to put themselves among the league leaders in runs scored. Alas, they have the same rub as the Indians: little room for improvement. They have not been especially hard hit by injuries, their best players are playing well (maybe even too well to sustain, at least in Michael Young’s case of .333/.377/.529), and none of their offensive weapons have much room for improvement, save the enigmatic Richard Hidalgo. The main difference between Texas and Cleveland is that Texas has only two decent starting pitchers. The first alienated the entire fan base by beating a 98-pound cameraman and might have to be traded during the pennant race. The second is a rookie, and September can be the cruelest month to rookie starting pitchers. Their place atop the adjusted standings has more to do with the Angels outperforming their component stats than some untold story of Ranger greatness. They’re on pace for 87 wins, but don’t be surprised if that number is more like 82-83 and behind the A’s.

Baltimore: The Orioles have been a fun story, but Buster Olney even saw this one coming. It seemed like their time was pretty much through when Boston first knocked them out of first place. While they’ve shown signs of life by taking three of four from the Red Sox before the break, they’re 17-24 since May 26th and many of their stars are aging and fragile (Mora, Sosa, Lopez, Palmeiro). I like the idea of trading for Burnett, who is capable of putting up a great run, and getting Bedard back will help offset Rodrigo Lopez and Bruce Chen returning to their roles as Rodrigo Lopez and Bruce Chen. However, this team is not as deep or talented as its divisional counterparts, and 10 of their last 13 games fall against New York or Boston. The 87.5 win pace seems too generous here, as well. I would expect something more like 82 and a smile for a winning season.

New York: I saved the team that scares me for last. Since their brutal 11-19 start, they’ve had organizational meetings, a disappointed Joe Torre, questions about what is wrong with Randy Johnson and in-house promotion unlike any in recent memory. All the turmoil has come during a run where they have gone 35-21, winning 62.5% of their games. The $200MM albatross has been pretty dominant since that rocky start, and we can probably expect more additions before the end of July, especially with a Boss still posturing as irate. Their current winning percentage would only get them to 87 wins, but if they win games in the second half at the same rate they have since their early swoon, it gets them to 93.5, and that’s before taking into account their shiny new toys.

I think the division leaders all have a strong grasp on their positions, but Anaheim and Chicago should slide back pretty far. Boston is the only one of the three who I think will improve in the second half, partially because I trust Theo Epstein and Bill James to make a couple of the best late-season moves in baseball. Ultimately, though, I think we’ll have our 3rd straight NY-Bos ALCS.

Wednesday, July 13, 2005

What can Boone do for You?
(Or: Bane? Boom? Boone.)

After hearing the news that the Twins acquired Bret Boone, a friend of mine joked that he wanted to give him a fruitcake to welcome him to Minneapolis. I couldn’t help but thinking that a Winstrol-cake would do Boone and the Twins a lot more good. It isn’t fair to pick on him as a steroid user, as none of us really know whether the juice contributed to his success. Nonetheless, it is difficult to find another player with such a meteoric spike in power numbers past his physical peak who experienced such a cataclysmic collapse upon the league’s introduction of the steroid policy.

Still, Boone probably isn’t as bad as his .231/.300/.385 line he has put up this year, but he’s probably not going to get back to his career average of .266/.325/.444. Taking out his three peak seasons from 2001-2003, his career averages are .253/.315/.414, which smells about right for the upside for the rest of ’05. That line fits with what he did in ’04, and he probably has not dropped off too much more from there in terms of true ability. Going from a losing team to a contender and a pitcher-friendly park to a more neutral one can’t hurt either.

The real question is what Boone’s arrival means for the Twins the rest of the way. In a wild card race that figures to be very close, a couple of wins can make a huge difference. To look at what Boone’s could do for the Twins chances, I’m using the Marginal Lineup Value rate to examine what his stats mean to the average lineup compared to the alternatives in the lineup. This formula works by setting the rest of the lineup to league average, then plugging in different players and calculating what they add or subtract on a game by game basis. Keith Woolner explains it in depth on the link above.

Twins IF MLVr/ Expected RS
Null: 0.000 802
Boone (current pace): -.113/ 784
Boone (proj. .253/.315/.414): -.054/ 793
Cuddyer: -.058/ 793
Rodriguez: .010/ 804
Punto: -.011/ 800
Rivas: -.263/ 760
Castro: -.279/ 757


The expected Runs Scored figure is based on a lineup of nine league average players. Each individual added represents a lineup with eight average players and that one player’s offensive contribution. Since we are looking at infielders and the numbers are not position adjusted, it isn’t so bad that they are mostly below league average in offensive numbers, especially when the one premium offensive position (3B) could easily get above average by season’s end. Also, the Twins’ lineup isn’t quite “league average” as it stands at the ASB. They project to only about 746 runs for the season, far less than the 802 that the league-wide component stats suggest as the average.

Additionally, the RS figure looks at what a player would do for a full year. Boone’s impact on the average lineup for a year would be to subtract about 9 runs, whereas Castro (yes, worse than Rivas) would cost the offense 45 runs. Using the rate stat for the remaining 76 games and swapping out Rivas for Boone at 2B, all else held constant, Boone would cost the average lineup about 4.10 runs, while Rivas would cost it about 19.98 runs. Even the depleted ’05 model of Boone only costs 8.59 runs, a big improvement over the status quo.

From this data, the best Twins infield going forward would include Boone at 2B, Punto at SS and either Cuddyer or Rodriguez at third. Castro’s defensive prowess might gain the team up to 10 runs the rest of the way if he is exceptional with the glove, but Punto’s a plus fielder at SS as well in limited action. Including both offense and defense, Punto is clearly the better choice. If Punto and Boone both live up to optimistic projections in the second half, it could be worth 20 runs of offense, and a couple of wins in the standings, well worth the PTBNL in a tight race.

Note: The MLVr data for all players except for projected Boone was taken from BaseballProspectus.com.

Tuesday, July 12, 2005

Dynastic Athletics

It is trendy to talk about the Oakland A’s 19-6 run, especially after their weekend sweep of the vaunted White Sox. But with the Twins, Indians, Yankees, Orioles and Rangers sitting above them in the standings, it would be exceedingly difficult to grab the Wild Card, even though they are only 4.5 games out. I’m more interested, and I’m sure Billy Beane is as well, in the next several years and the core he has to build around.

Usually when we talk about a young core of players, we refer to somewhere around 5 guys who the team can use as a stable locus. Think early ‘90s Astros with Bagwell, Biggio and Bell. Or the Braves with Smoltz, Glavine, Avery, Justice and Gant. A dynasty might go as deep as the Yankees circa ’96, featuring a young Jeter, Bernie, Posada, Pettite and Rivera. Teams don’t usually have stability over several years with a gaggle of young talent.

Look at this year’s Oakland team, which is already near contention: Chavez and Crosby are locked in on the left side. Dan Johnson will probably be mashing at first for years. Ginter/Ellis sounds temporary to me, but it’s not that hard to imagine shifting Omar Quintanilla over to make a pretty slick-fielding keystone duo that can actually hit. Kotsay and Swishwer will hold down center and right through at least 2008, and Richie Robnett, Nelson Cruz or former first-rounder Freddie Bynum could fill in the last spot. With Daric Barton presumably DH’ing at some point, and the triage of catchers they have drafted in recent years, they have a core of players covering every position. The Hudson and Mulder trades had the same effect on the pitching staff, setting up Harden, Meyer, Blanton and Haren at the front of the rotation for at least the next two or three years before anyone is eligible to leave. Huston Street anchors the pen, followed by Duchscherer and Calero, and eventually Cruz and Jairo Garcia. The rest of the roster can be slightly above replacement level and they should easily win 95 games a year if nobody totally collapses. I know I’d rather have this roster than the Yankees’, irrespective of cost, for the next several years.

Monday, July 11, 2005

Buyers vs. Sellers

I don’t understand why teams have to be “buyers or sellers” in the trade market. Why can’t teams assess one another’s needs and try to fill them? For example, the Mets have surplus starting pitching, albeit a pretty vanilla assortment after Pedro. Anaheim thinks that Darrin Erstad is their best first base option, leaving Casey Kotchman out of a job. Since they lost out on Carlos Delgado, the Mets have suffered through Doug Mientkiewicz war against OBP. Meanwhile, on the left coast, the Angels have had good things from Bartolo Colon, Jarrod Washburn, Paul Byrd and John Lackey, but need another starter for an AL West that’s starting to look competitive. Escobar can’t be counted on for much, and Santana has been below replacement level so far. When Steve Trachsel comes back from the DL, he will join Martinez, Benson, Zambrano, Ishii, Glavine and Heilman as (debatably) capable starters. Seven starters, no first basemen. There seems to be no need for either of these teams to be “sellers” to help one another out. Would it really be such blasphemous Post-fodder to swap out Heilman and a prospect for Kotchman’s bat?

First Half Notes

The All-Star Break (heretofore ASB, not for convenience, but to placate my ego by repeating my own initials) is a time for reflection. I have never seen journalists as a particularly introspective portion of the population, but the proliferation of “First Half Awards” columns must have some cause. I’ll go with the slow news week as the cause. MLB.tv’s silence drives me crazy, and I don’t have a deadline to meet. As it stands, I don’t have the journalistic merit to subvert custom, so here we go with the 2005 Twins ASB report:

Happiest Surprises:

Carlos Silva: Many viewed Silva’s 2004 as a fluke, with Baseball Prospectus expressing “pessimism” regarding his ability to repeat the success. PECOTA pegged him for a 4.67 ERA and a 23.6 Value Over Replacement Player (VORP). Silva has beaten back that projection by reducing an already miniscule BB rate- 35 in 203 IP in ’04- to mid-90s Maddux rate of only 5 BBs in 114 2/3 IP. Indeed, he leaves a lot up to his defense, only striking out 3.22 per 9, but the extra seeing-eye singles don’t hurt as much without the freebies on base. While his HR rate has crept up a bit, it hasn’t approached disturbing levels, and his GB/FB ratio has actually improved from last season (1.68). As for PECOTA? Silva currently sports a 3.53 ERA and a team-leading 27.3 VORP. All told, the Twins mined a dusty Phillies’ reliever and polished him into a gem of a sinkerball pitcher.

Jacque Jones: Admittedly, he’s been a train wreck since early May, but who thought that he would be leading the team in BBs (37) by a comfortable margin at the ASB? I realize that the internet’s depersonalization makes this exercise futile, as I cannot see your response, but if your hand is up, you are a liar. Jones isn’t just looking at more pitches, either, as his K rate has come down a bit. An optimist or a true Jacque Jones fan would say these marks are signs of real improvement in the long-stagnant 30 year old contract-year player. I, however, would readily jettison him at the trade deadline if the right offer came around from a team desperate for a RF who wears his cap slightly askew. If not, I would let him walk at season’s end, plug Ford into RF, start feeding Mike Ryan rocket fuel, and hope Kubel can return as a meaningful contributor.

Luis Rivas: Only because he almost made it to the ASB without eclipsing 100 ABs.

Joe Mays: Two years ago, Mays tried to pitch with an elbow that would not allow him to throw his curveball. The result was an over-reliance on an uninspiring changeup, making him to Brad Radke what Blues Brothers 2000 was to the original Blues Brothers: similar looking at first glance, but really altogether wretched. John Belushi did well to die before associating with either one. PECOTA is stingy when it comes to playing time, especially to players coming off of injuries. Mays has already exceeded his IP projection by 12, and in a much more acceptable fashion than expected. But it all may be a house of cards built over a pile of highly enriched uranium, as his peripherals indicate bad, bad things. His projected 3/2 K/BB ratio has been on the money, as has been the prediction that he would strike out about three batters per nine. With a good-but-not-great GB/FB ratio (1.31), he’s walking a tightrope that will probably snap sometime in the second half.

Biggest Disappointments:

Justin Morneau: Although he is one of my favorite players on the planet, I have to admit that I expected much more this year. I have waited long enough to see a 30 HR season by a Twin, but every time I think someone is a lock, I’m brought back to earth, and it hurts more each time. One would think that a player would be at his worst after taking a beaning in the noggin (all Canadians' heads should be called noggins), but Morneau put up his best numbers after coming off his early DL stint. Through roughly the same playing time that he saw last year, Morneau’s BA and OBP have held steady, but his SLG has dropped precipitously, from .536 to .477. He’s been downright dreadful against lefties to the tune of .235/.261/.318, and has lived up to his reputation as a minus fielder at first. His struggles against LHP aren’t unique for young lefties, though, and if the biggest knock on a 24 year-old masher is that his SLG has come down a bit in his second tour of the league, he’s in pretty good shape going forward.

Mike Cuddyer: Everyone has always loved Cuddyer’s potential. Remember when he was plugged into RF in the 2002 DS against Oakland even though he looked thoroughly lost? His bat was supposed to make him a stud; all he needed was regular playing time. Now that he’s back at third, he has fizzled, losing a full 85 points of his PECOTA projection for SLG, from .467 to .382. He’s been out-VORPed by Luis Rodriguez in 104 PAs, and has done little to relieve the stress on the battered infield. There are two possibilities here: one is that everyone missed the boat; that his minor league track record was dead wrong, and all of the sophisticated projection metrics whiffed. The other is that these 13 weeks have been something of an aberration and he will regress to the mean over time. Maybe he’s not the .850 OPS slugger we thought he was, but he can still be a useful piece in an otherwise shaky infield.

Injuries: It’s hard to pinpoint a player who hasn’t lived up to his performance record this season. Everyone has pretty much been on the pace that he had set for himself in years past, but Gardy has been forced to cobble together lineups that include far too much Castro. Looking back, 48-38 is pretty lucky considering the infielders that have been generating outs for the first half.

Omissions:

Jesse Crain: The wins and the “vulture” tag are fun, but don’t be duped into thinking that K rate is meaningless. In the show, he’s struck out 29 to 23 free passes in his first 68 2/3 IP. Sure, it’s possible that he has undermined mountains of data that suggest the pitcher controls Ks, BBs and HRs but has little control thereafter, in the same way that it’s possible that I could have a successful major league career. Someone needs to talk that Crash Davis out of him. Strikeouts aren’t boring, and even if groundballs are more democratic, I’ll take an fascist Pedro Martinez any day.

Johan Santana: By a hair. Aaron Gleeman recently compared last year’s line to this year’s through 18 starts to show the striking similarity. The main difference is that Santana isn’t coming off of elbow surgery this year. Naturally, he will perform below his optimal level for a while after someone fishes around his inner-arm with a scalpel. No such excuse this time. However, it seems like he has been near dominant throughout his struggles with a little bad luck sprinkled in at inopportune times. I know that cold data will not support this claim, but I’m not going to throw Cy Young under the bus just yet. He’s not what he was in the second half last year, but he’s not what he was in the first half this year either.

With Santana and Cuddyer probably improving and Mays and others falling back, next time I will try to look at exactly how much they can expect to gain or lose and what that will mean in the standings.

Welcome!
Minnesota Baseball Central is a new Twins blog in which I hope to offer original statistically-influenced insight on Terry Ryan’s collection of grown-ups who play games for money. Since this post is the origin, chances are only friends and family will ever bear witness to it, but I shall offer some background nonetheless. I now live in Washington, DC, so most of my firsthand baseball experience these days is in the upper bowl of RFK.
One of my earliest baseball memories is sitting in the upper deck to see Jack Morris in game one of the 1991 World Series, and I feel some of that euphoria every time I set foot under the massive white roof. Regardless, I will surely be in attendance to see the Twins in daylight for the grand opening of the outdoor stadium in 200? (or 20??, or 2???). Some special part of the Metrodome’s mystique undoubtedly died with Bob Casey, and a new day in Twins baseball must dawn.
I obviously cried when Kirby got glaucoma, but everyone down to Junior Ortiz on those winning teams has a special place in my heart. Not that I’m a bandwagon fan, but suffice to say that the Serafini-Stahoviak era has an aftertaste akin to soap.
Today, it pains me to watch Luis Rivas, Juan Castro, et al bungle away potential wins with meek choppers in the name of preserving chemistry and infield defense, but I understand it as a fact of life. Besides, a Johan K, or an over-the-baggy mash by Morneau more than makes up for the bad times. My goals in writing are twofold: first as a personal catharsis, but also to provide some research-based writing that I would like to read but cannot always find. Plus, I’m sick of having lots to say about baseball in general, but never saying it, then forgetting. So if nothing else, this site can be my personal diary. Without a lock. Which I want other people to read. And that’s where the metaphor breaks down.
Anyway, welcome to MBC and enjoy.